
The DHPI is sitting at R3.1 million — and it’s still climbing.
Durbanville’s median has firmed steadily through the first half of the year, up from R2.95m in January. Not a spike — the slow, stubborn climb that comes from real depth of demand.
up from R2.95m
last 12 months
still a seller’s market
next call 23 July
The index through 2026
The DHPI is anchored on the Lightstone median — what homes actually sell for — refreshed three times a year.
median growth, H1 2026
That’s ahead of national house-price inflation (~5% a year) and in step with greater Cape Town, which led every metro in the country. Slow and steady — exactly what you want under a home’s value.
Ignore the “average asking price” you’ll see online
Property portals show an average asking price for Durbanville of around R5.6m — inflated by a handful of R8m–R16m estate listings that sit for months. It tells you nothing about what homes actually sell for. The honest market is tight and consistent: a Lightstone median of R3.1m, a blended sale average near R2.9m, and the busiest activity between R2m and R3.5m.
Durbanville is a ladder, not a number
Treating the whole suburb as one average is the most common pricing mistake. Where a home sits on the ladder changes everything.
Durbanville vs the Northern Suburbs
Typical / median levels — what homes really sell for — so the ladder reads true. Durbanville sits at the top, with depth of demand across every band.
Buyers climb the ladder — entering in Kraaifontein, Bellville and Brackenfell, then moving “up the hill” into Durbanville as their needs change. That inward migration is a structural floor under Durbanville prices.
What the market is made of
A freehold-and-estate suburb first, an apartment market second — nearly 44% of stock sits inside estates.
Security and lifestyle-estate living is the structural demand driver here — not a fashion. Buyers skew 36–64: established families and professionals.
Under ~5–6 months is a seller’s market. Stock has crept up but stays tight — Cape Town vacancy sits near a record-low 1.07%.
The 3-bedroom home is the engine
Live listings by bedroom count, Dec ’25 → May ’26. Three-bed stock is climbing (167 → 198) — that’s where the buyers are, and increasingly the competition.

Durbanville Golf Club, from above — my own drone photography
What’s driving it
Semigration
Still a net inflow to the Western Cape, though cooling. Durbanville’s schools, security and lifestyle keep pulling families in.
Structural scarcity
Cape Town vacancy near a record-low 1.07%. Quality stock in good school zones is genuinely short — homes sell in weeks.
Estate & lifestyle demand
Security, the wine valley, and a maturing commercial hub — R7bn+ of building investment over the decade.
Rates — now a headwind
The May 2026 hike ended the easing cycle and has held. Affordability has stopped improving; next SARB call is 23 July.
What it means if you’re selling
- Price to the achieved market, not the asking market. Anchor to comparable sold prices in your pocket and bedroom count — ignore the inflated online averages.
- The rate turn is an honest reason to act. Buyers waiting for cheaper money have learned the cycle has turned and stayed turned.
- 3-bed homes face rising competition. Presentation and marketing quality are now the difference between two weeks and two months.
- Premium stock (R6m+) needs patience and exceptional marketing — professional photography, video, drone and a proper digital launch. The thinner the buyer pool, the more each one has to be reached.
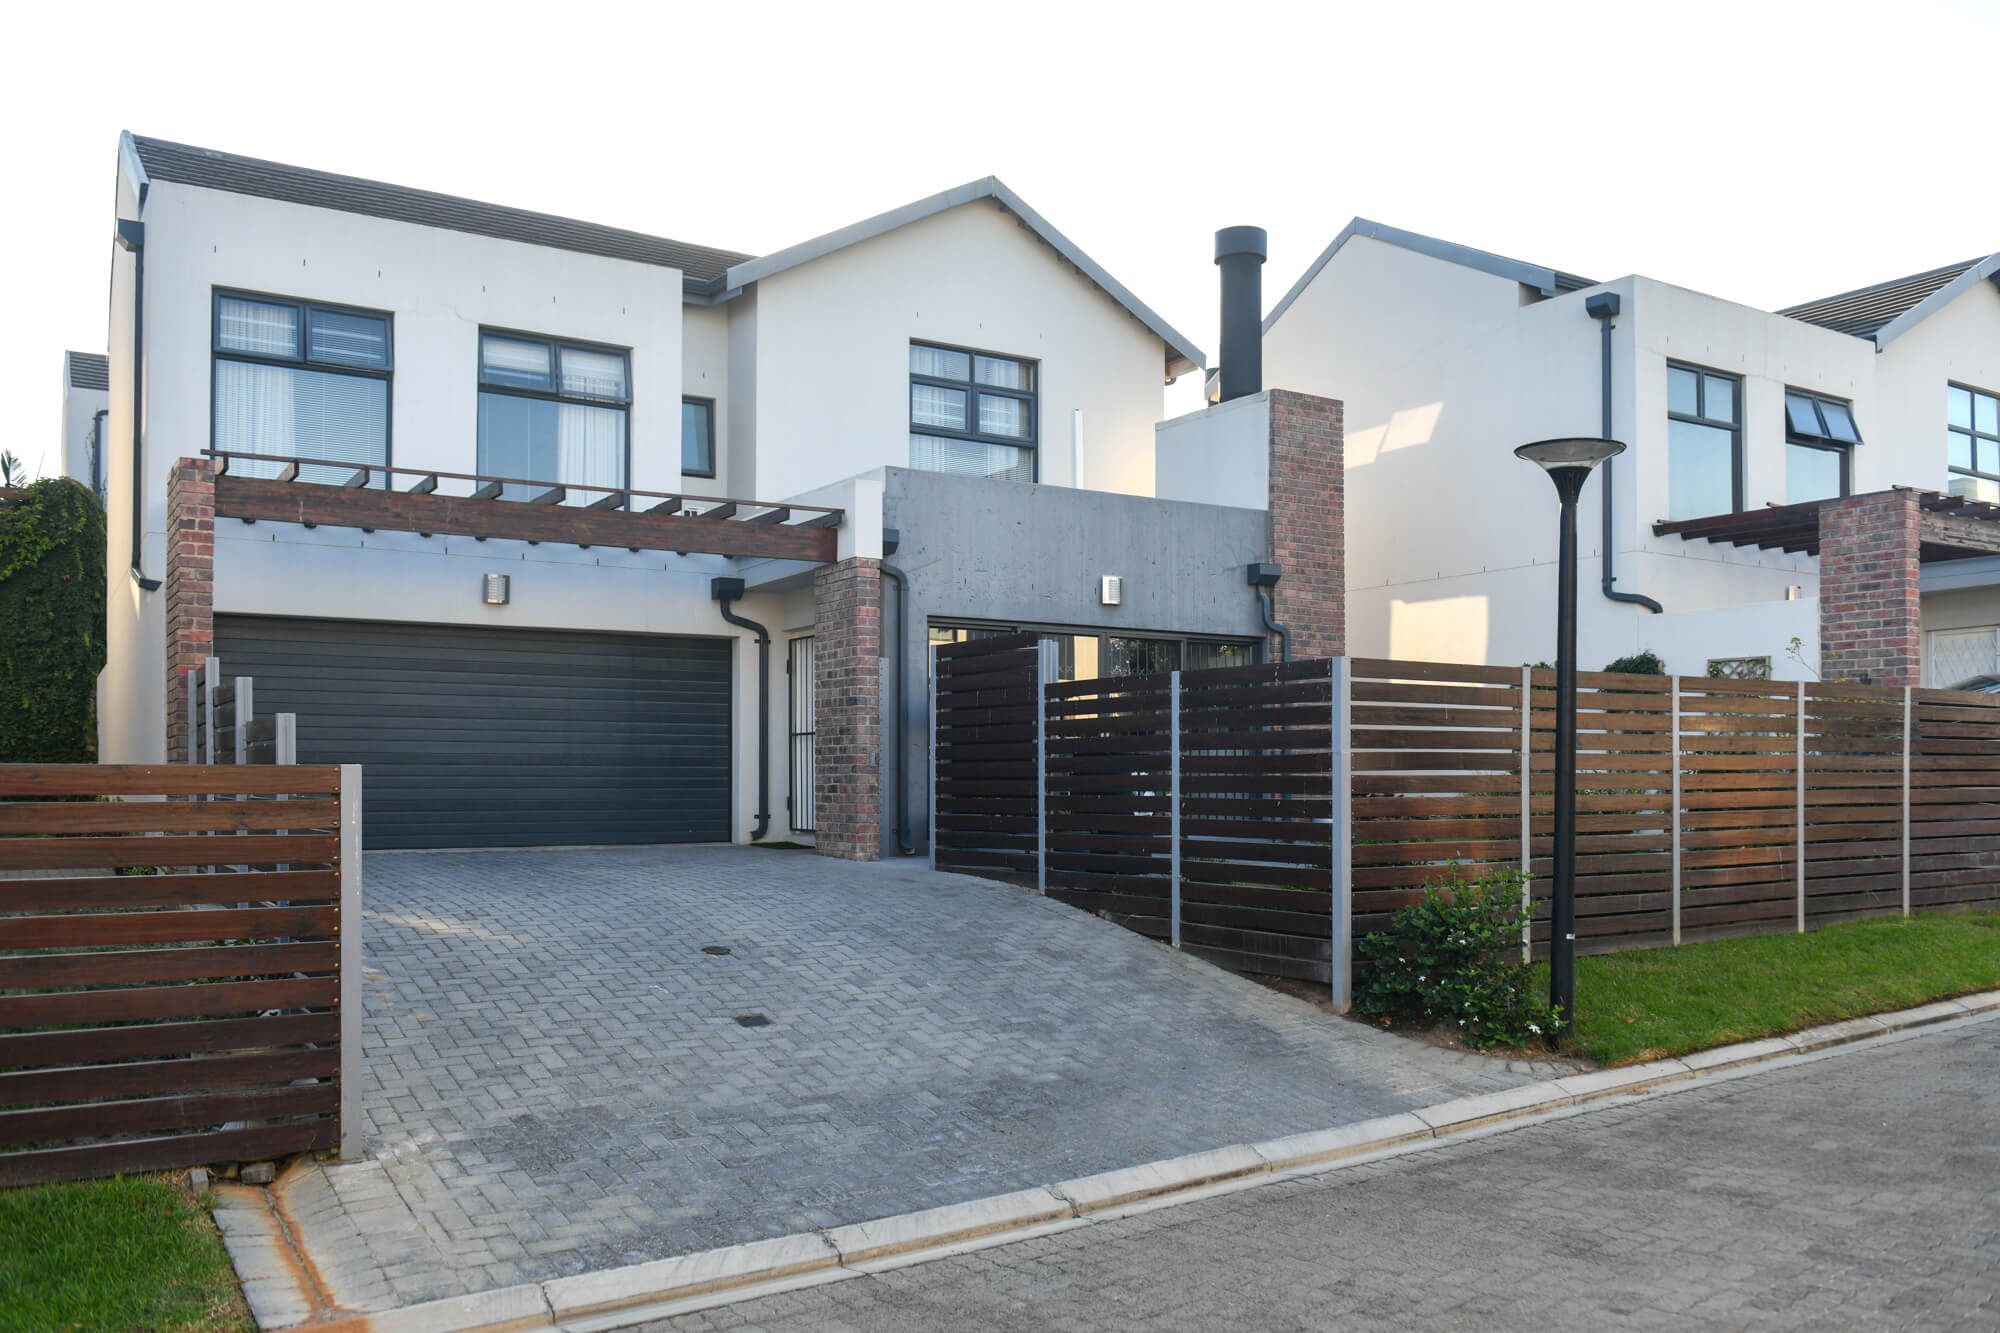
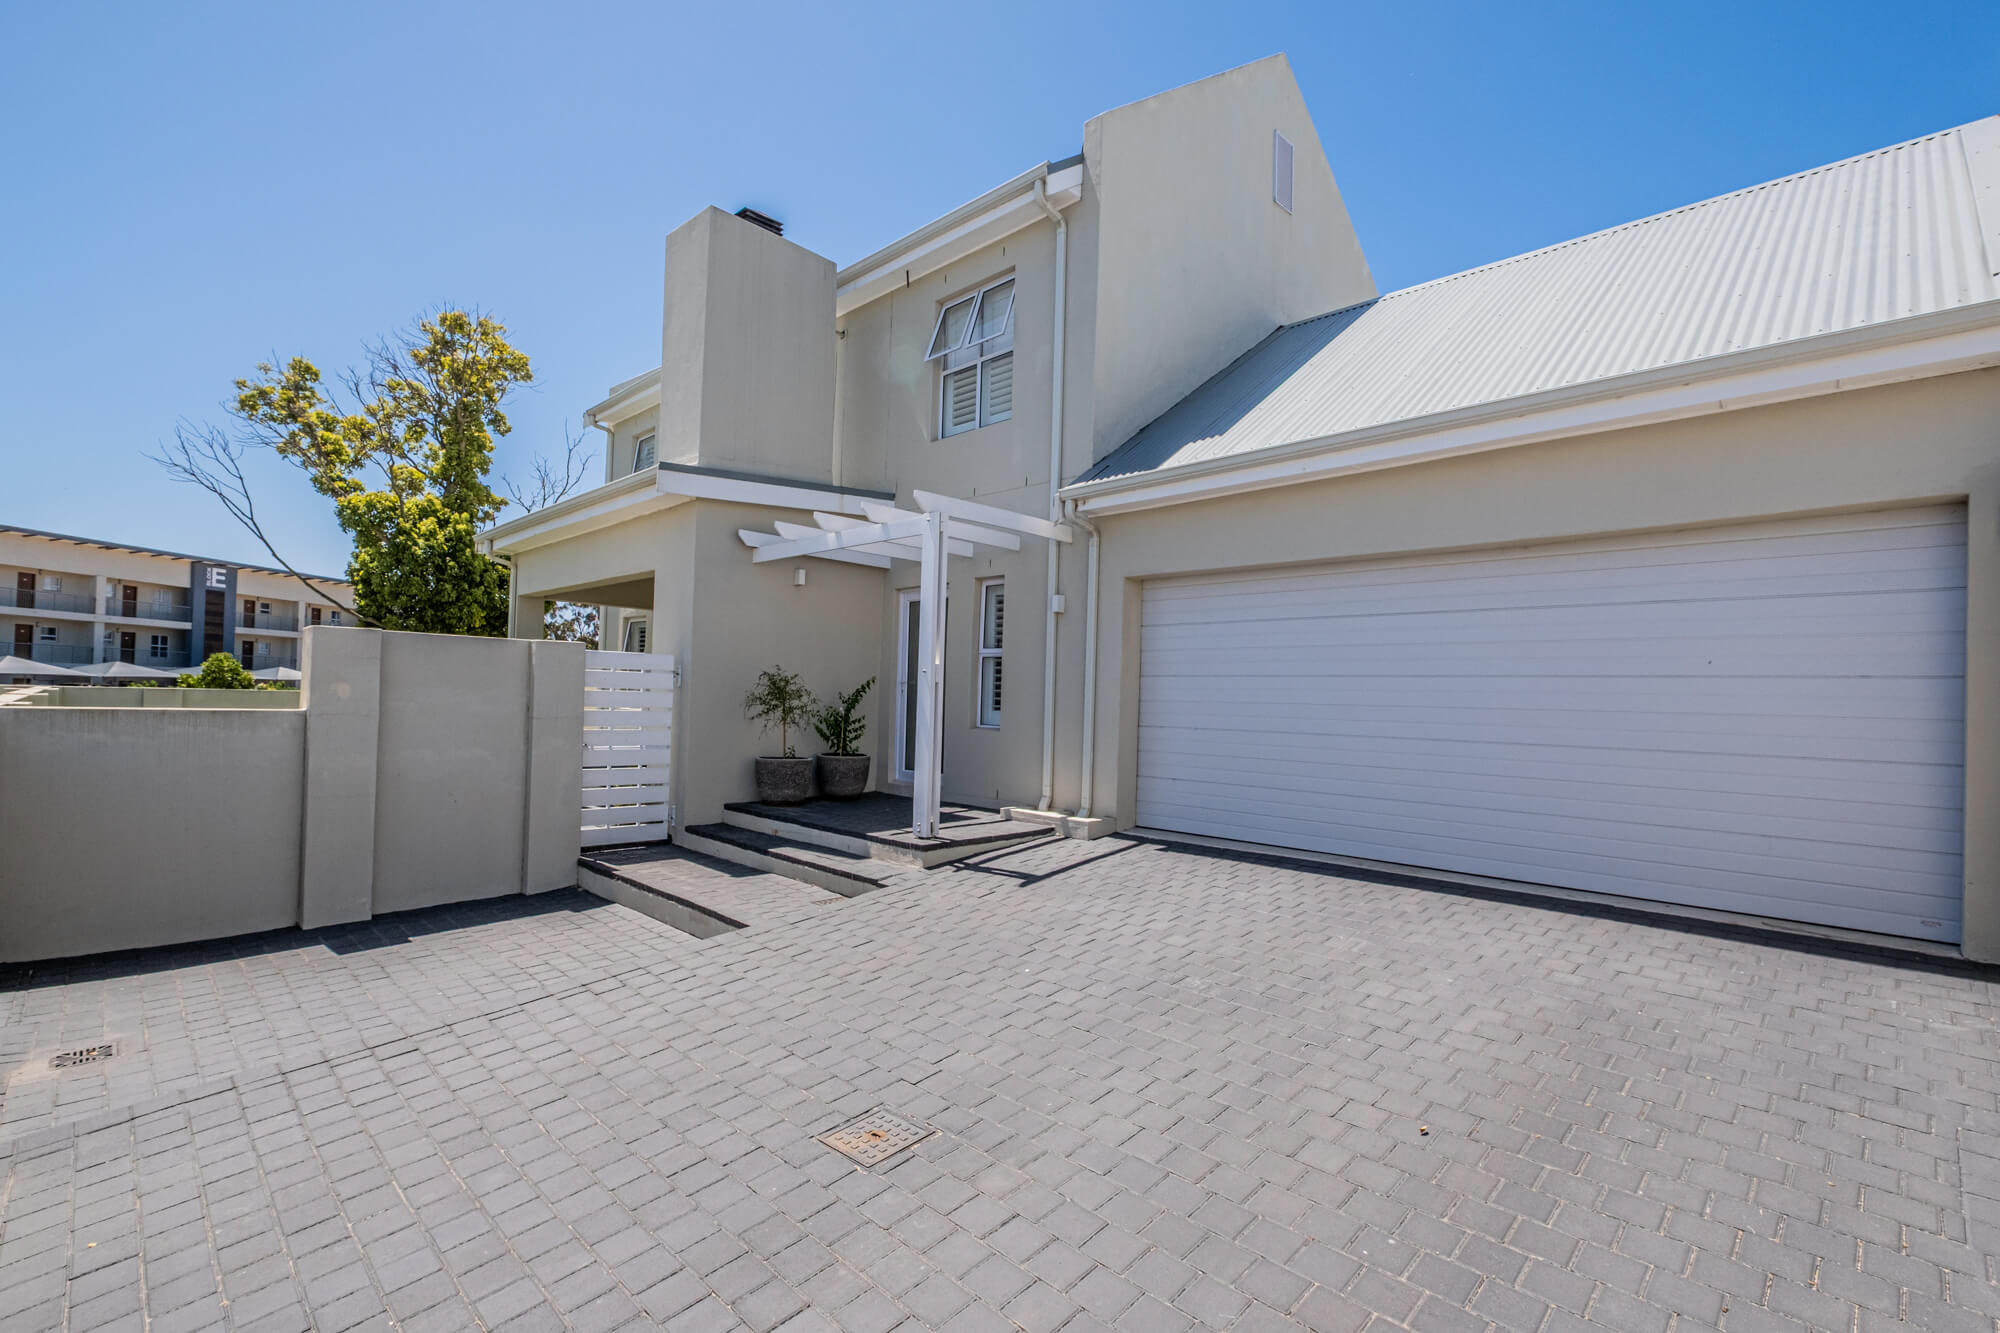
A look around Durbanville
Real homes across the ladder — every image shot by me, not stock.

Wondering where your home sits on the ladder?
I’ll give you a proper, data-backed read on your exact street and bedroom type — grounded in the DHPI, not a thumb-suck. No pressure, no sales pitch.
💬 WhatsApp me — a message or a voicenoteMethod & honesty: the DHPI is anchored on the Lightstone median (registered deeds), not the “average asking price,” which runs high (~R5.6m) and is excluded here. Blended average = total transfer value ÷ number of transfers. Months of supply = live listings ÷ monthly sales rate. Figures gathered and cross-checked July 2026 and are indicative, not a valuation. For a property-specific figure, request a CMA.